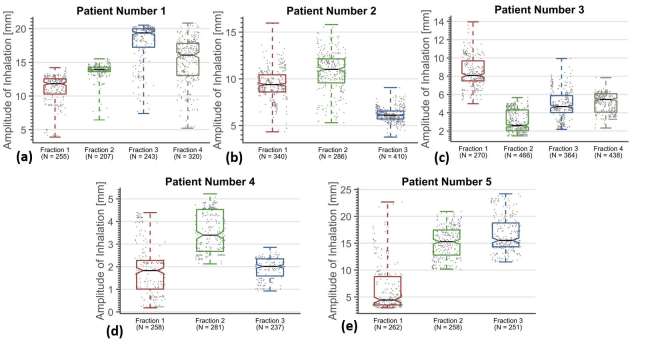
Figure 3.
Variation in amplitude of breathing, showing amplitude of individual inhalations (grey dots) and boxplots per fraction showing the median (black line), interquartile range (coloured boxes) and min–max range (whiskers) of the amplitudes. The interval endpoints of the medians are displayed as notches in the boxes, representing the 95% confidence interval on the median.

