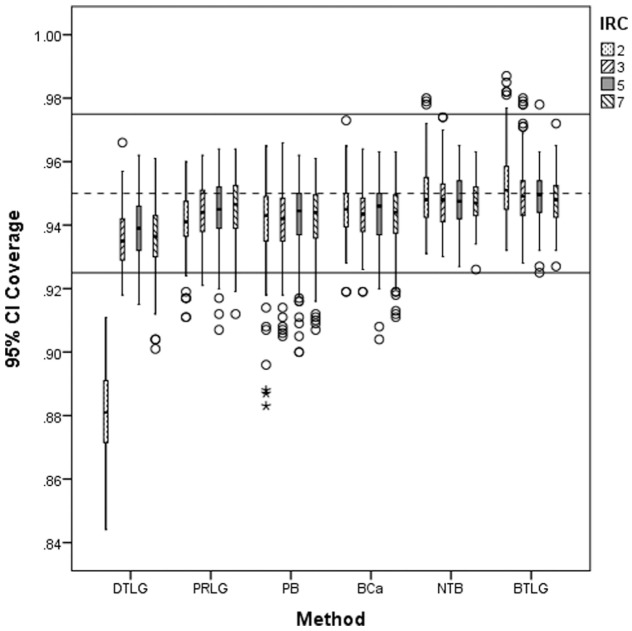
Figure 2.
Distribution of 95% CI coverage for item response category (IRC) at Type 2 distribution.
Note. CI = confidence interval; DTLG = delta method with logit transformation; PRLG = three-step parceling with logit transformation; PB = percentile bootstrap; BCa = biased-corrected and accelerated bootstrap; NTB = normal theory bootstrap; BTLG = bootstrap SE with logit transformation; dashed line is at .95 and solid lines at [.925, .975].

