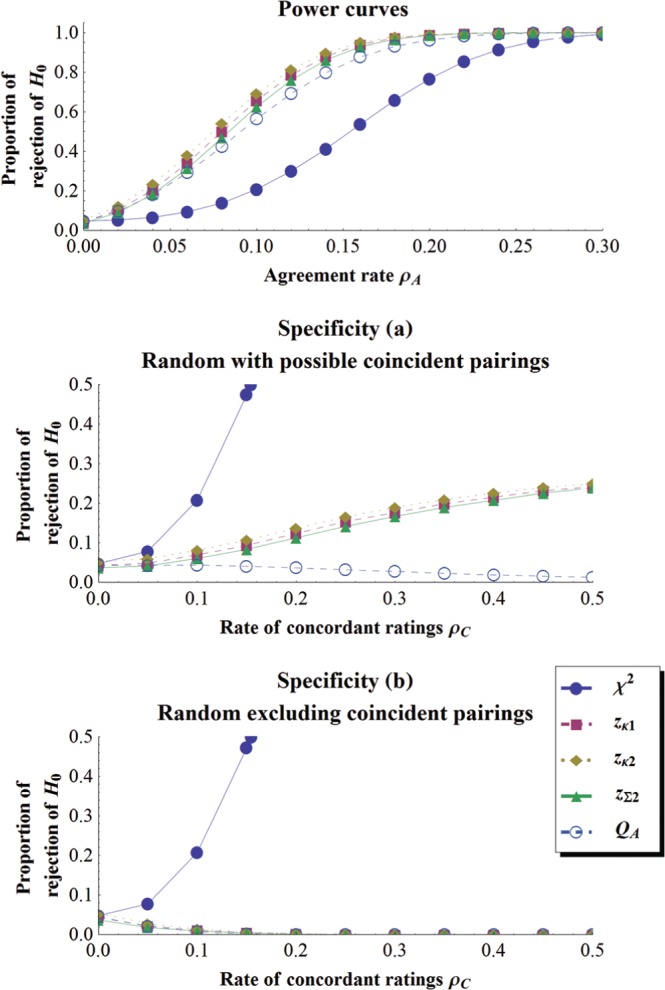
Figure 2.

(Top panel) Power curve for 5 tests of interrater agreement as a function of the true agreement rate (ρA) when k = 5 and N = 125; (Middle and bottom panels) specificity for the same tests in the same condition as a function of the rate of consistent categorizations (ρC).
