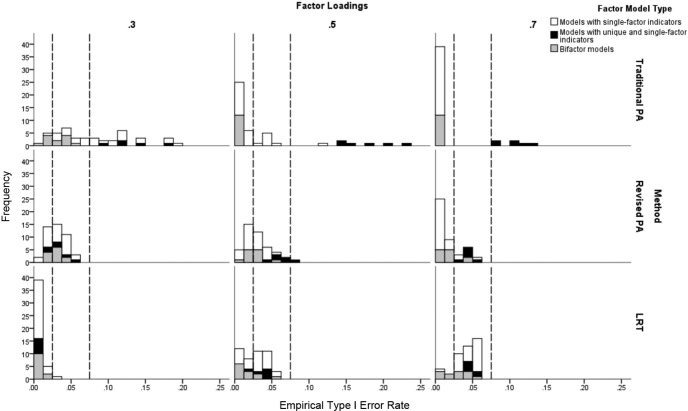
Figure 2.
Empirical Type I error rates for conditions with models with two or more factors. For bifactor models, the factor loadings are those for the general factors, not the group factors. The pairs of lines at .025 and .075 represent the lower and upper limits of an acceptable alpha using Bradley’s (1978) liberal criterion.

