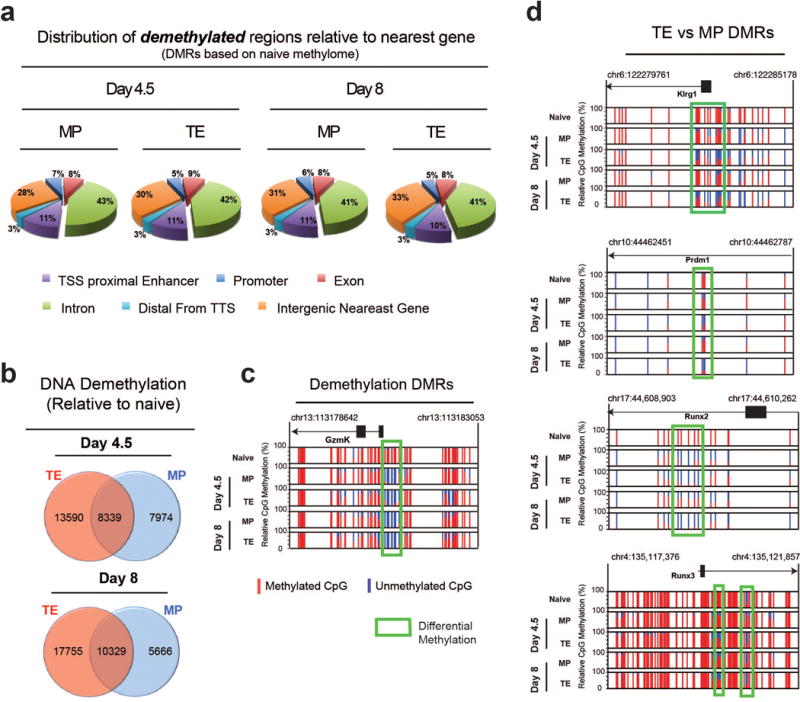
Extended Data Figure 4. Both MP and TE CD8 T cells acquire demethylated effector loci.

A) Pie chart representation demethylated DMR genomic distribution relative to the transcriptional start site of the nearest gene. B) Venn diagram of regions that undergo demethylation during differentiation of naïve CD8 T cells into TE and MP subsets. C) Normalized graph of methylation at CpG sites in the Gzmk locus of TE and MP WGBS data sets. D) Normalized graph of differentially methylated CpG sites in the Klrg1, Prdm1 (Blimp1), Runx2, and Runx3 loci from TE and MP WGBS data sets.
