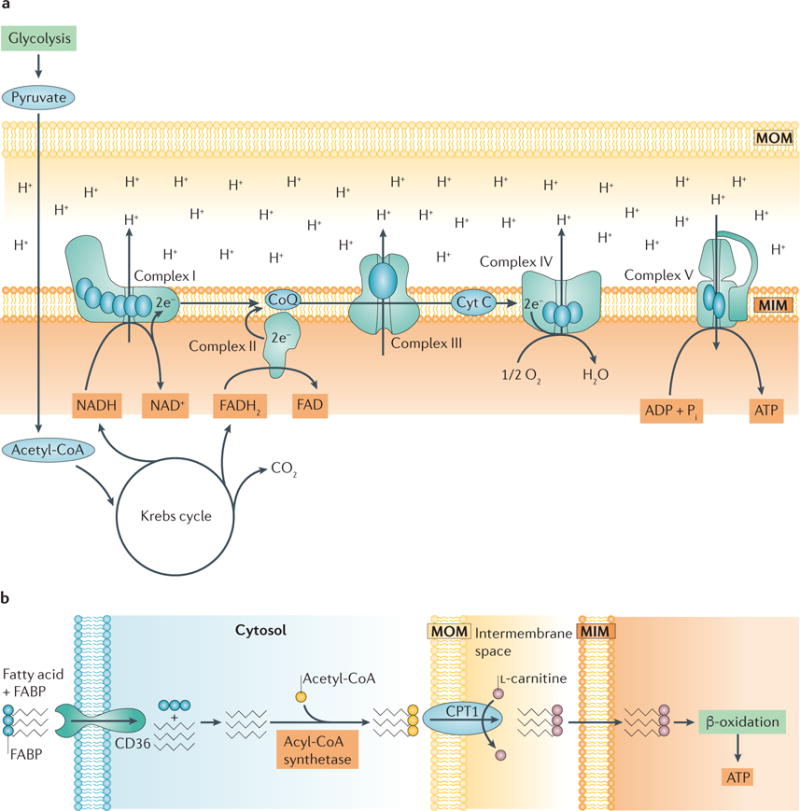
Figure 1. ATP production in the kidney.

a | The electron transport chain (ETC). A functioning ETC transforms reducing equivalents from NADH and FADH2 to produce NAD+ and FAD+, respectively. The electrons (e−)that are produced travel through the complexes of the ETC and are ultimately accepted by oxygen at complex IV. As electrons are transferred from complex to complex, protons (H+) are actively pumped out from complexes I, III, and IV into the intermembrane space, maintaining the membrane potential and driving the production of ATP by ATP synthase (also known as complex V). b | Fatty acid transport and activation in renal proximal tubule cells. Proximal tubules require large amounts of ATP to drive ion transport and therefore rely on aerobic respiration, the most efficient mechanism for producing ATP. Fatty acids are a main source of energy for proximal tubules because more ATP can be produced from one molecule of palmitate than from one molecule of glucose18. Fatty acids bound to fatty acid-binding proteins (FABP) are transported into the proximal tubule cell via platelet glycoprotein 4 (also known as CD36) and activated by the addition of acetyl-CoA in the cytosol via acyl-CoA synthetase. Activated fatty acids are transported into mitochondria via carnitine O-palmitoyltransferase 1 (CPT1), which exchanges their acyl-CoA group for L-carnitine, whereupon they undergo β-oxidation to produce ATP. CoQ, coenzyme Q; Cyt C, cytochrome c; MIM, mitochondrial inner membrane; MOM, mitochondrial outer membrane; Pi, inorganic phosphate.
