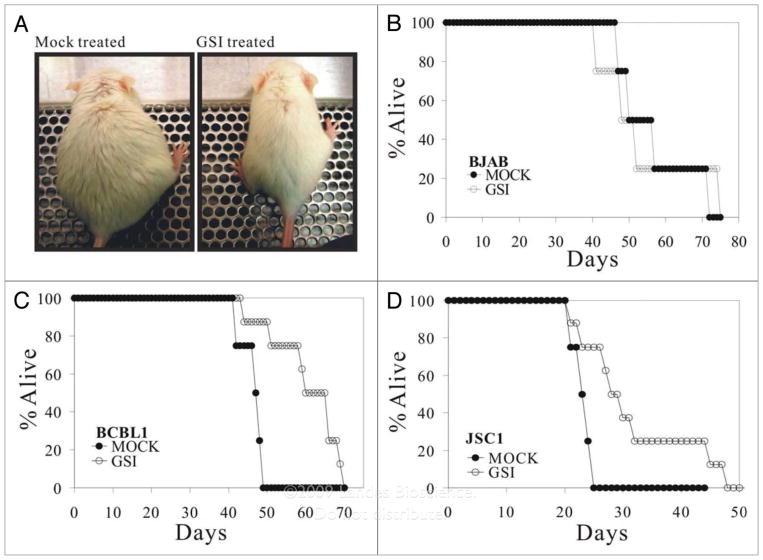
Figure 1.
Survival curves for GSI treated NOD/SCID mice inoculated with KSH V positive PE Ls. (A) Gamma secretase inhibitor (GSI) treatment of PEL/SCID mice delayed tumor growth. NOD/SCID mice were inoculated with BCBL1 cells (1 × 10⁷) on day 0 respectively, KSH V-negative Burkitt lymphoma BJAB was used as a cell line control. Daily injection of GSI (30 mg/kg) was initiated at day 5 post cell inoculation. For BCBL1 and JSC1 cell transplantation group, mock-treated SCID mice (left) receiving DMSO presented with abdominal distention and were significantly heavier at 25 days post cell inoculation than SCID mice treated daily with GSI (right). These two mice are the representatives from BCBL1 cell group. For BJAB cell transplantation group, there is not significant change between the mock-treated and GSI-treated mice. (B, C and D) The survival curves for GSI-treated and mock-treated SCID mice. NOD/SCID mice were inoculated with BJAB (1 × 10⁷ cells/mouse), BCBL-1 (1 × 10⁷ cells/mouse), or JSC1 cells (1 × 10⁷ cells/mouse). Daily i.p. injection of GSI (30 mg/kg) per mouse was initiated at 5 days post-inoculation. 8 mice were used per group. Mean survive time (MST) was increased by 25% and 40% for BCBL1/SCID, JSC1/SCID, respectively. The formula for calculating MST is as following: %MST increase = (MSTGSI treated − MSTmock)/MSTmock.

