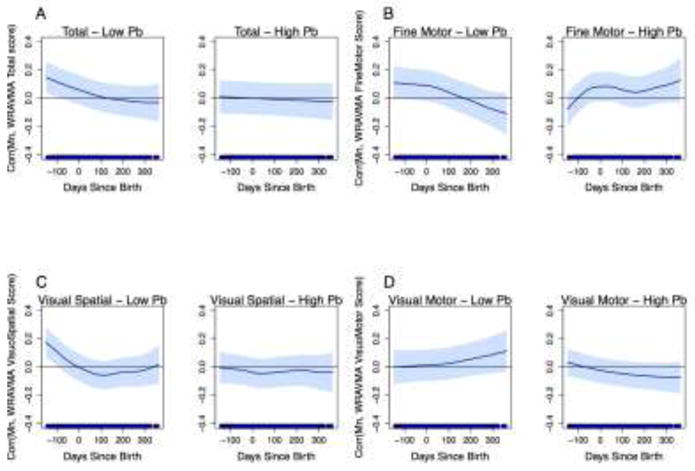
Figure 4.

Associations between fine-scale resolution tooth Mn levels and WRAVMA scores, stratified by tooth Pb levels at median. GAMMs using adapted distributed lag-type approach, adjusted for child sex, tooth Pb levels, maternal IQ, maternal education, and study cohort. Models use complete case method. Dark blue line represents association over time; light blue shading represents 95% confidence intervals. Thin black line indicates correlation = 0. (A) Total score; (B) Fine motor subtest score; (C) Visual spatial subtest score; (D) Visual motor subtest score.
