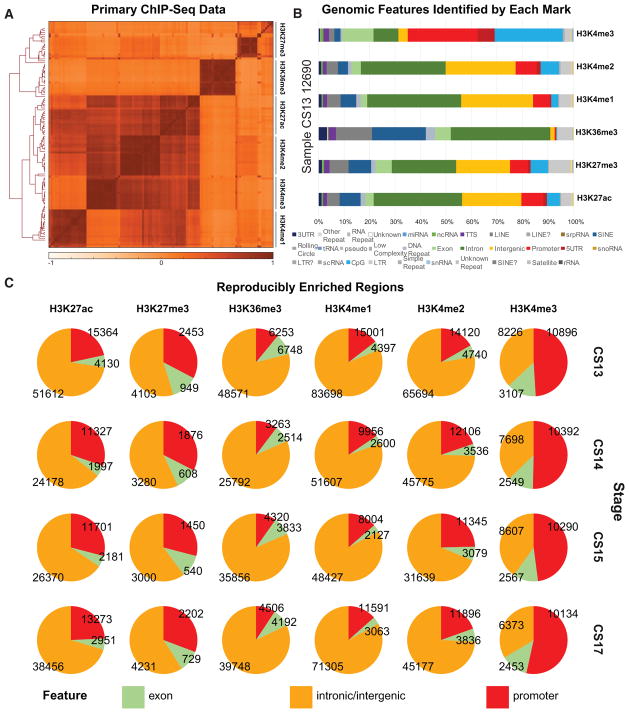
Figure 2. Histone Modification Profiles in Human Craniofacial Development.
(A) Heatmap and hierarchical clustering of pairwise Pearson correlations for non-overlapping 10-kb bins across the human genome for 114 individual histone modification profiles from human craniofacial tissues. Relatedness of epigenomic profiles by sample is indicated by dendrogram along the vertical axes of the heatmap. Darker orange indicates positive correlation between datasets.
(B) Genomic feature annotations identified by peak calls from six histone modification profiles from the same tissue sample plotted as cumulative percentage of total peaks. Peak enrichments and genomic annotations were performed using HOMER (Heinz et al., 2010).
(C) Histone modification peaks identified in at least two separate tissue samples from the same developmental stage and annotated into three broad categories: promoter (2 kb upstream of transcription start site [TSS]), exons, and all other intronic or intergenic locations. (See also Figure S1 and Table S1.)

