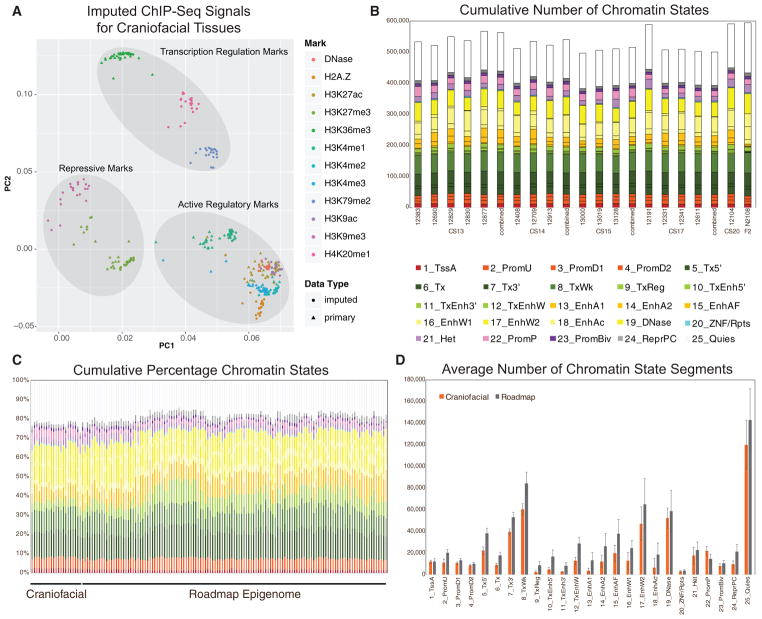
Figure 3. Imputation of Craniofacial Epigenomic Signals and Chromatin State Segmentation.
(A) Principal-component analysis projection of first two component dimensions for 252 imputed and 114 primary epigenomic profiles for human craniofacial samples across non-overlapping 10-kb bins. Samples are color coded by epigenomic mark and shapes indicate primary versus imputed data types. Samples generally cluster into three broad categories of activity: repression, regulatory element activation, and transcription regulation. (See also Figures S1D and S1E.)
(B) Numbers of individual chromatin state segments identified by each of the color-coded 25 states of chromatin activity based on imputed epigenomic signals for each of the 21 tissue samples profiled.
(C) Comparison of cumulative percentage of each chromatin state between craniofacial samples profiled here and 127 segmentations generated by Roadmap Epigenome (Roadmap Epigenomics Consortium et al., 2015).
(D) Mean numbers of segments annotated in each of the 25 states across 21 craniofacial samples (orange) and 127 Roadmap Epigenomes (gray). Error bars represent SD. Overall chromatin state segmentation in craniofacial samples identifies similar numbers and percentages of each of 25 states published by Roadmap Epigenome (Roadmap Epigenomics Consortium et al., 2015). (See also Figure S2.)

