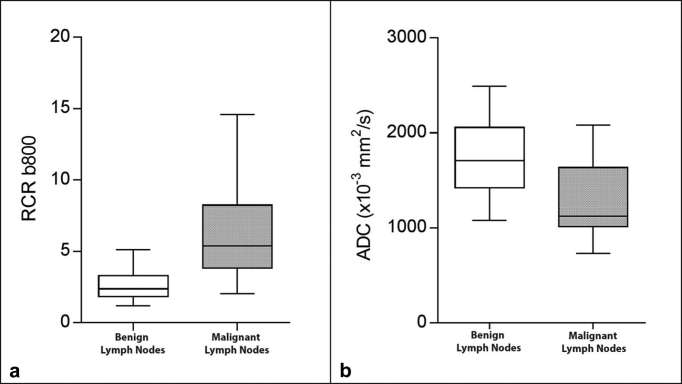
Figure 3.
Box and whisker plots of relative contrast ratio-B800 and apparent diffusion coefficient of the two histological groups of lymph nodes. The boxes show the 25th and 75th percentile (interquartile) ranges. Median values are shown as a horizontal black bar within each box. The whiskers show levels outside the 5th and 95th percentiles.

