
Figure 4.
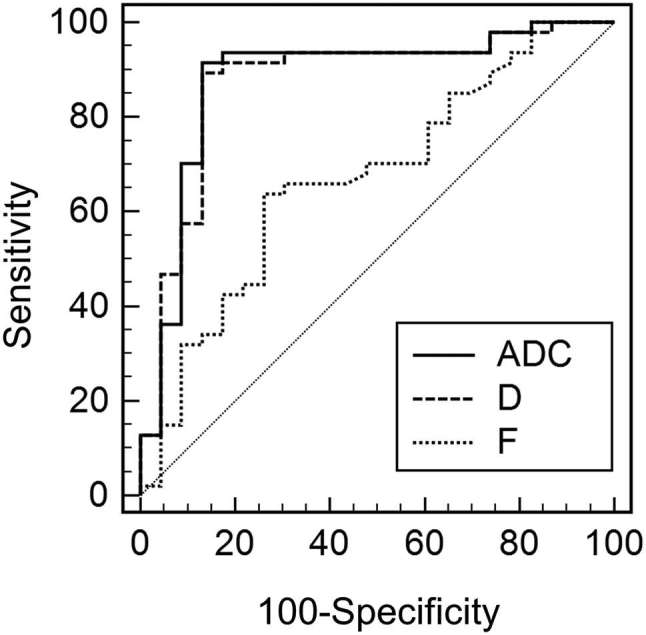
The ROC curves of Dand f, and ADC for differentiating malignant from benign musculoskeletal tumours. The areas under the curves were 0.880, 0.874 and 0.671, for ADC, D and f, respectively. There was no significant difference in the diagnostic performance of D and ADC (p = 0.53). ADC, apparent diffusion coefficient; ROI, region of interest.