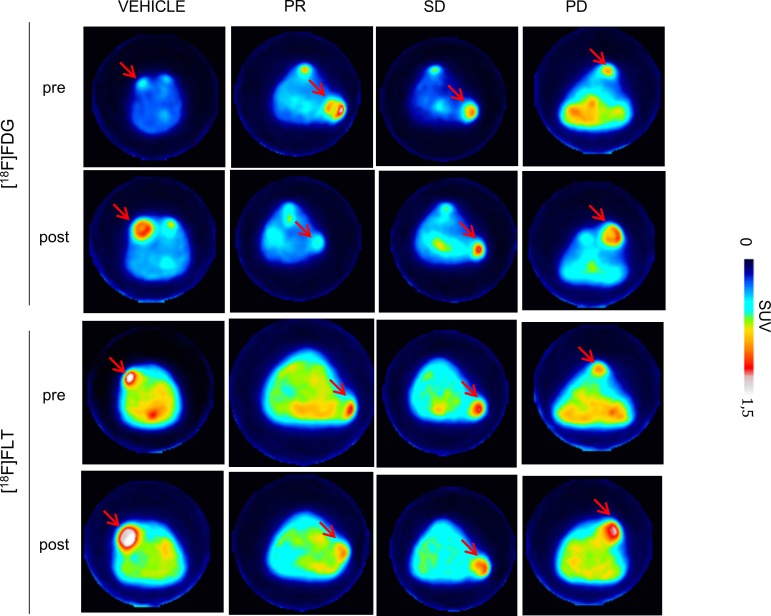
Fig 3. PET imaging of TNBC mouse model.
Images of [18F]FDG and [18F]FLT scans of representative MDA-MB-468 xenografts mice performed pre and post PTX treatment. [18F]FDG and [18F]FLT uptake decreased in PR and SD, in contrast to the observed increase in PD and vehicle. Red arrows indicate cancer lesions. Color scale represents SUV value. PR = partial responder; SD = stable disease; PD = progressive disease.

