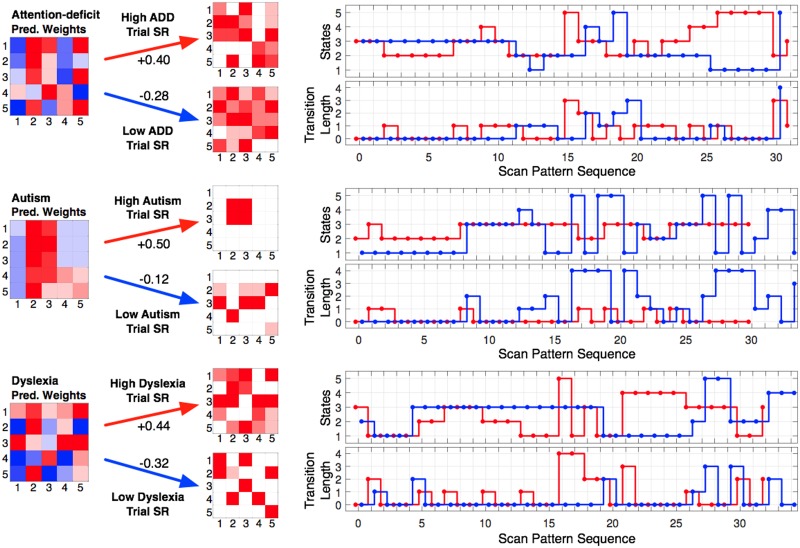
Fig 5. Illustrative scan patterns for for each clinical trait SRSA model in state space.
The mean cross-validated prediction weights for the best SRSA model are shown for each clinical measure. Illustrative scene state transitions that were most strongly positively (red) and negatively (blue) correlated with the prediction weights and their corresponding trial SRs are shown to the right of each set of prediction weights. The top scan pattern panel shows the state transitions at each sequential position and the bottom scan pattern figure shows the transition length of each state transition. In the prediction weights and trial SR matrices the x-axis represents the sender state and the y-axis represents the receiver state.

