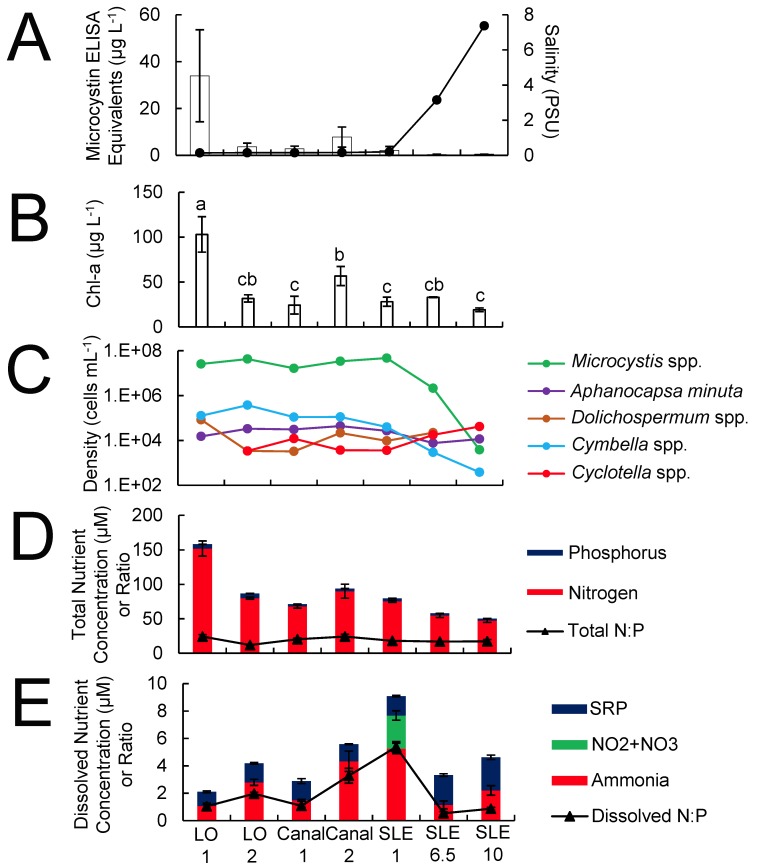
Fig 2. July 2016 transect data of sites that represented a strong salinity gradient.
Included are microcystin and salinity values (A), chlorophyll a concentrations (B), densities of the five most abundant phytoplankton (C), and total (D) and dissolved (E) inorganic nitrogen and phosphorus concentrations and ratios. Algal densities are represented on the log scale in C. Error bars denote standard deviations.

