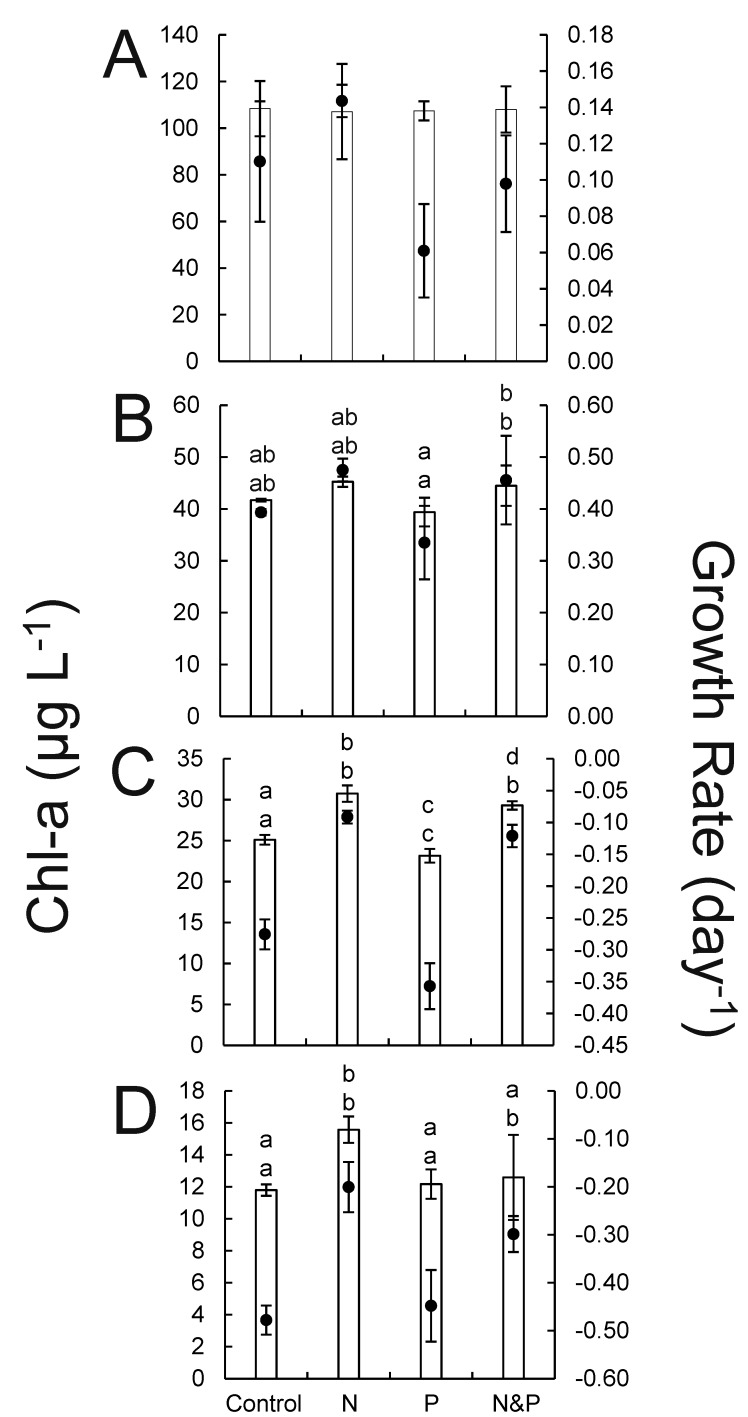
Fig 5.
Chlorophyll a (bar) and specific growth rate (black circle) data from July 2016 24 h nutrient amendment experiments from samples collected from sites LO 1 (A), SLE 1 (B), SLE 6.5 (C), and SLE 10 (D). Error bars denote standard deviations. Statistical significance (p < 0.05) among sites is denoted by different letter combinations. Top and bottom letters above bar graphs correspond to statistical differences in chlorophyll a and specific growth rate, respectively.

