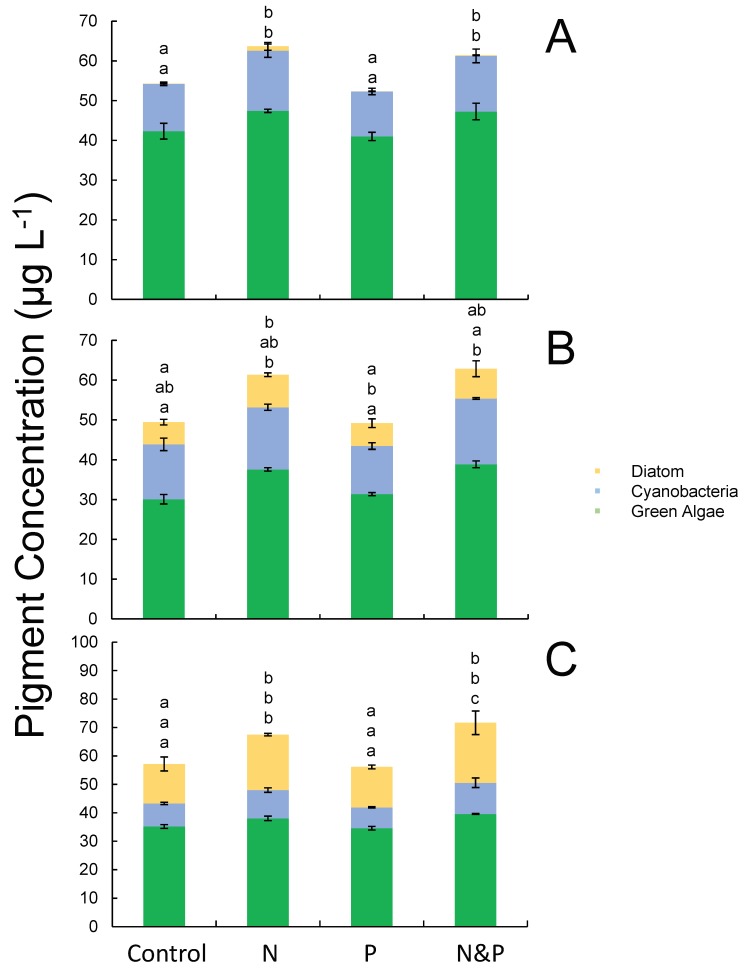
Fig 9. Diatom, cyanobacteria, and green algal pigment concentrations at 48 h from the September 2016 nutrient amendment experiment.
Samples were collected from sites LO 1 (A), SLE 1 (B), and SLE 6.5 (C). Error bars represent standard deviations. Statistical significance (p < 0.05) of specific pigments among sites is denoted by different letter combinations. Letters are ordered relative to the order of parameters listed in the legend. For A, only cyanobacterial and green algal pigment concentrations exhibited statistical differences among treatments.

