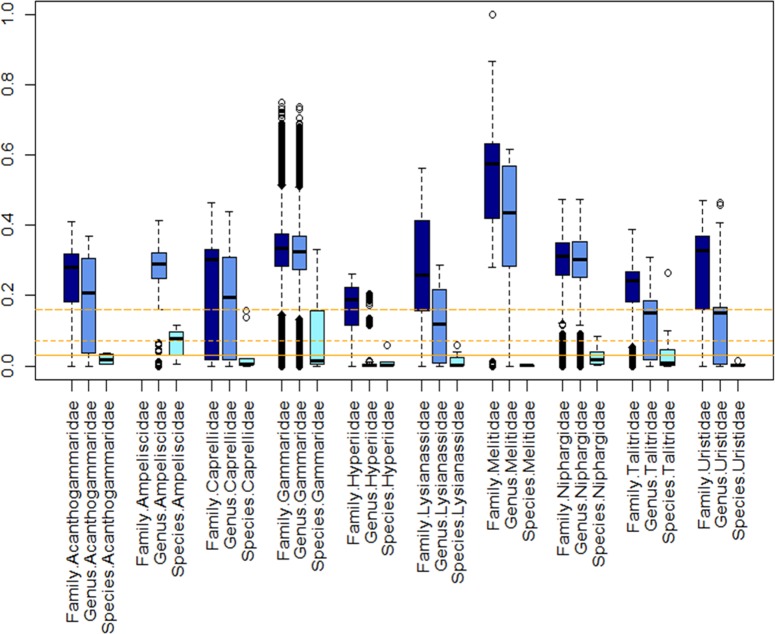
Fig 5. Boxplot distribution of the COI K2P distances for the 10 selected families representative of the Amphipoda order at the intraspecies (S–light blue), intragenus (G–blue) and intrafamily (S–dark blue) levels.
Median (central bar), position of the upper and lower quartiles (central box) and extremes of the data (dots) are represented. Black lines represent different thresholds used for discriminating species: long dash = 0.16 substitution/site [10]; dashed line = 7% of divergence (this study) and solid line = 3% of divergence [53].

