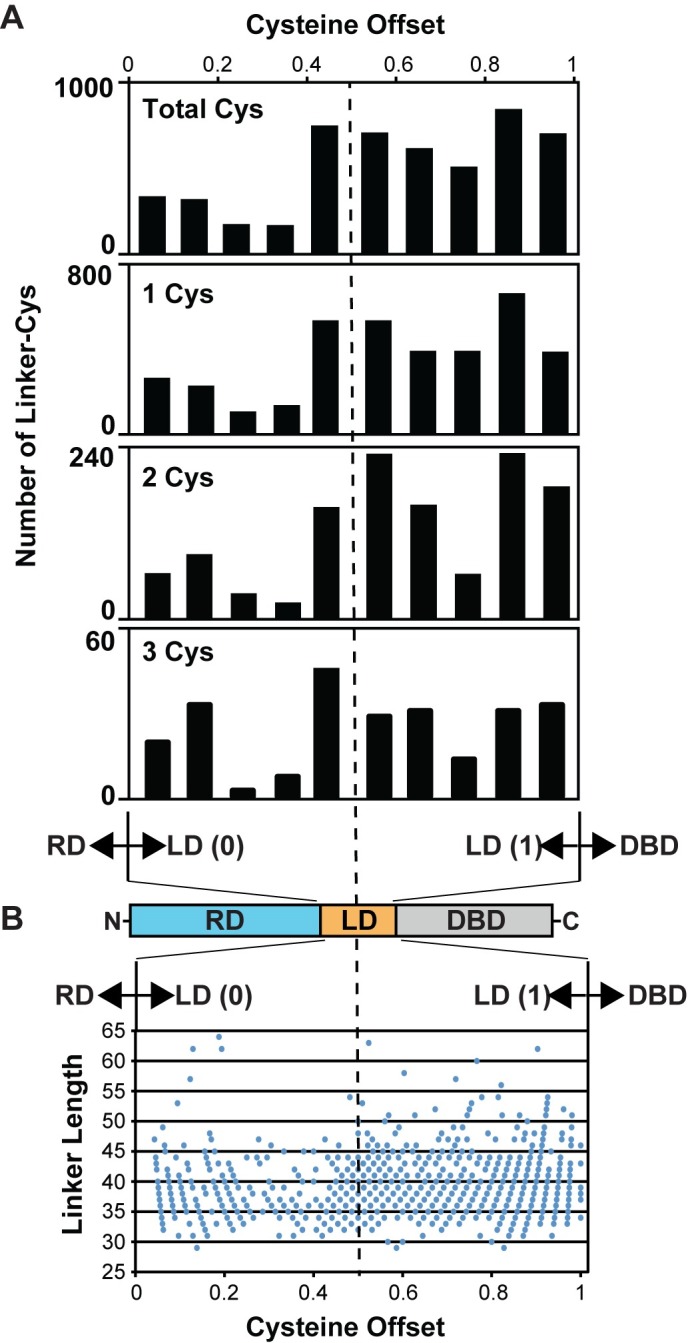
Fig 6. Informatics of linker length and cysteine placement in REC-DBD domain architectures.

(A) Bar graphs showing the number of single, double, triple and total cysteines found within block regions of the defined linker domain. Notice the obvious weighting to the linker C-terminus, closer to the effector DNA-binding domains. (B) Linker length versus cysteine placement plot from sequences where the linker contains only one cysteine. RD, regulatory domain; LD; linker domain; DBD, DNA-binding domain. The x-axis “cysteine offset” refers to cysteine placement from the N-terminus on the predicted linker (designated as “0”) and the C-terminus of the linker (designated as “1”). The center (0.5) of the predicted linker domains are designated by the vertical dotted line.
