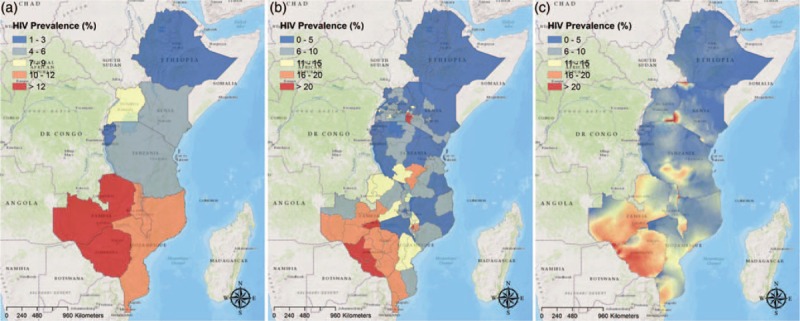
Fig. 2.
Using data from Demographic and Health Surveys conducted in 10 countries in eastern sub-Saharan Africa, HIV prevalence was mapped at three different scales of aggregation: (a) national level, (b) district level, and (c) high resolution mapping of 1 km2 pixel resolution using a Kriging interpolation technique.

Maps were created using ArcGIS software by Esri, version 10.3 [31].
