
Fig. 5.
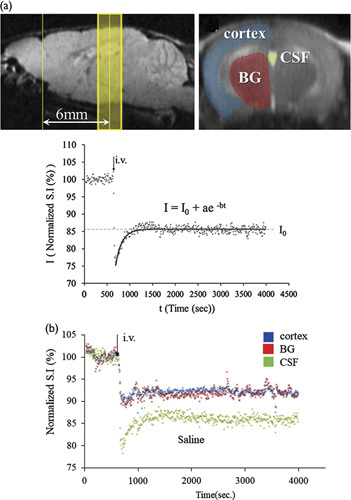
JJVCPE data. (a) ROI and decay curve fitting. Upper: scout film showing regions of interest (ROI). Imaging slab was set to 6 mm caudal from the top of the cerebrum (left) and ROI was selected semiautomatically using image processing software. Lower: Decay curve fitting. I0 shows the normalized signal intensity at infinite time (t=∞) calculated from the fitted curve. As described, higher tracer contents will yield lower I0. (b) Representative time course. Representative time curve of signal intensities within pixels of each ROI shown in (a) following intravenous (i.v.) [17O]H2O administration in control mouse. Blue: cortex, red: basal ganglia (BG), green: cerebrospinal fluid (CSF) within the third ventricle. Each dot represents the intensity of each pixel within the ROI.