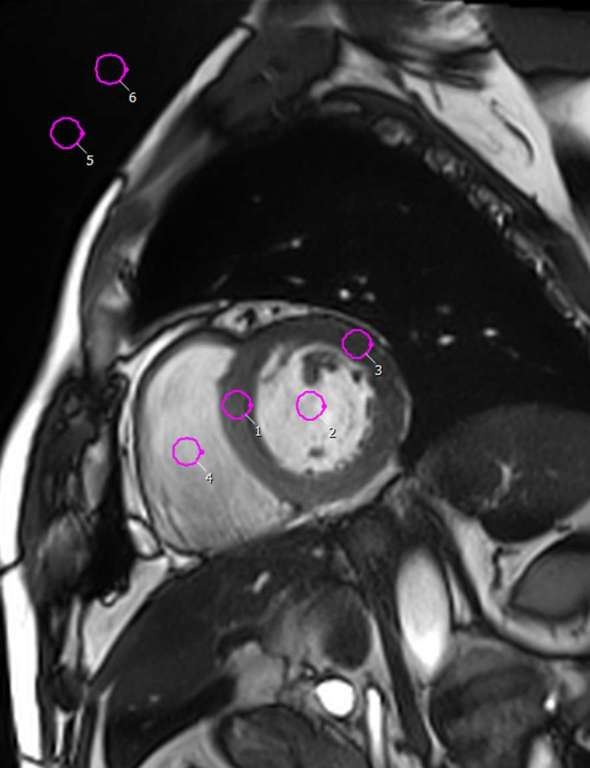
Figure 6.

Illustration of method for SNR and CNR measurements; ROIs are indicated by circles drawn within the ventricular cavity (2 and 4), the myocardium (1 and 3) and outside the image (5–6). CNR, contrast-to-noise ratio; ROI, region of interest; SNR, signal-to-noise ratio.
