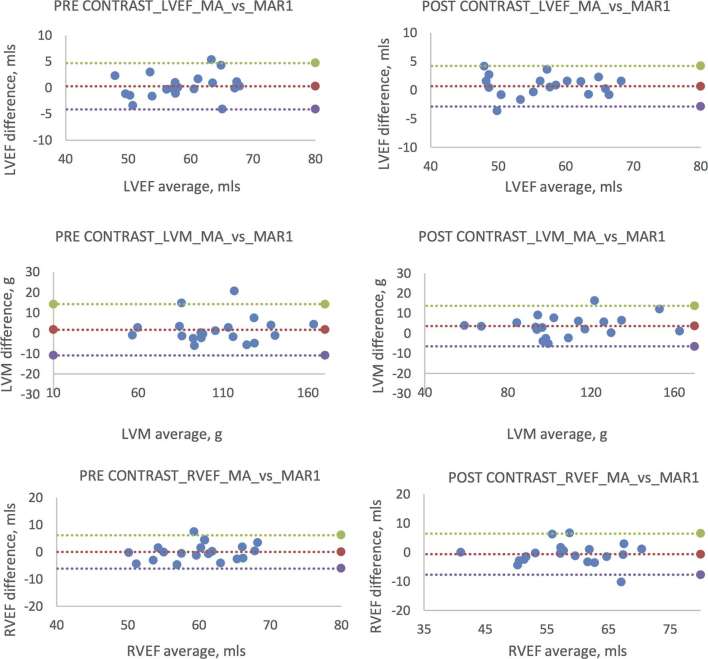
Figure 7.
Bland–Altman plots comparing manual pre- vs post-contrast intraobserver reproducibility for left and right ventricles. Individual plots comparing original MA with repeat analysis (MAR1). Pre-contrast plots (left column) are paralleled with post-contrast (right column) counterpart. *In all subsequent Bland–Altman plots mean difference is represented by the middle line with the upper and lower lines representing a ± 2 SD limit. LVEF, left ventricular ejection fraction; LVM, left ventricular mass; MA, manual analysis; SD, standard deviation.

