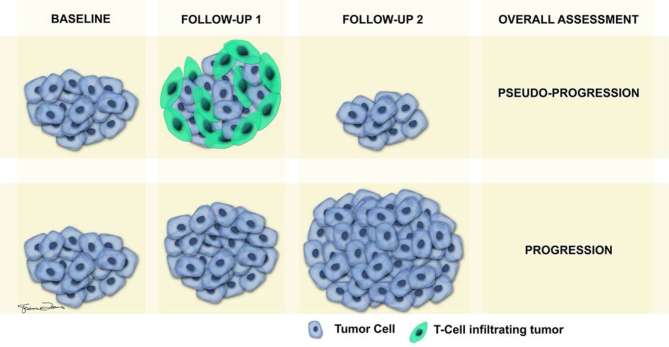
Figure 1.
Pictorial illustration depicting true vs pseudo-progression. Top row of images shows sequence of events during pseudo-progression at baseline, first follow-up and second follow-up scans. The apparent increase in size of tumour during first follow-up, which is typically obtained 4–6 weeks after baseline scan, is contributed by T-cells infiltrating the tumour. Second follow-up study performed ≥6 weeks later shows decrease in size of tumour compared to first follow-up, due to reduction of T-cells, leading to assessment of pseudo-progression. The bottom row of images shows gradual increase in size of tumour during the first and second follow-ups, due to infiltration by actual tumour cells, leading to the assessment of true progression.

