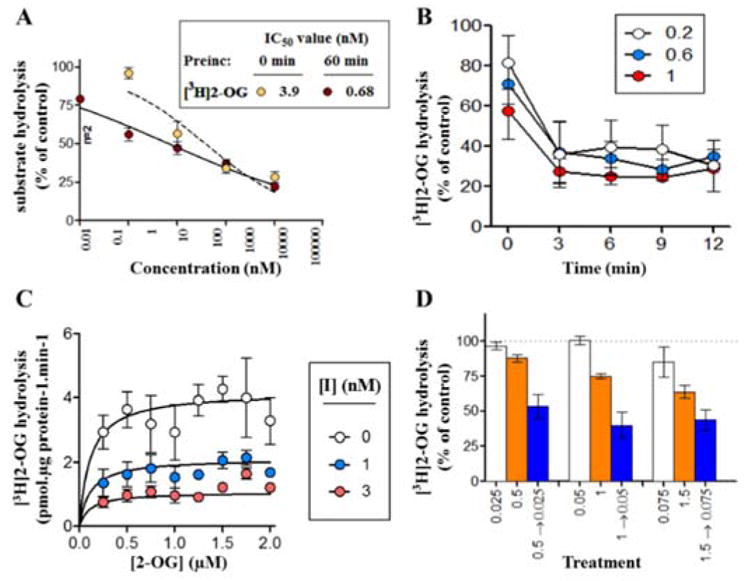
Figure 1.

Inhibitory properties of lead compound 10. (A) concentration-response curves for inhibition of 0.5 μM [3H]2-OG hydrolysis by rat brain MAGL, either without or with 60 min preincubation; (B) time-dependency of [3H]2-OG (0.5 μM) hydrolysis under three different concentrations (0.2, 0.6, and 1 nM) of 10 preincubated for the times shown; (C) the kinetics of inhibition by the compound (I, inhibitor 10) in the absence of pre-incubation and using a short incubation time (2 min); (D) the inhibition of 0.5 μM [3H]2-OG hydrolysis found by the compound in the absence of pre-incubation (white and orange bars) or in its presence after 60 min of pre-incubation followed by dilution to reduce the free concentration 20 fold (blue bar). For a reversible compound, the blue bar should match the corresponding white bar. Data are means ± SEM, n= 3–4 unless otherwise shown.
