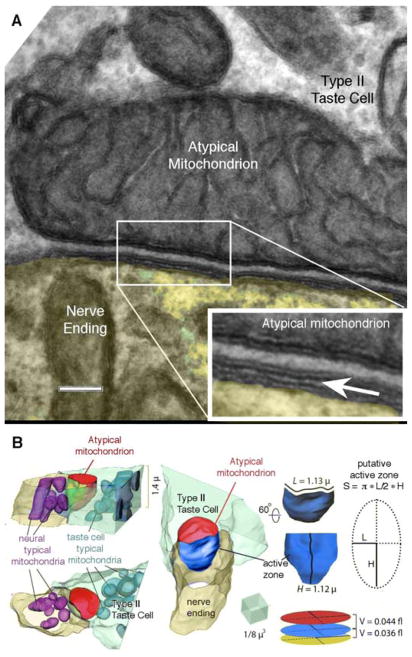
Fig. 5. Cell membrane specialization at the CALHM1-mitochondrial complex.
(A) Conventional transmission electron micrograph illustrating the relationship between the membrane of the atypical mitochondrion, the plasma membrane of the taste cells and the nerve ending. Inset at lower right is an enlargement of the boxed area in the main image. The insert has been enlarged (3x) and the edges enhanced by application of an Unsharp Mask filter (60% @ 5 pixels). The arrow points to the synaptic cleft between the taste cell and nerve fiber. The uniform spacing between the mitochondrial outer membrane and the plasma membrane strongly suggests the presence of a scaffolding to maintain this relationship. Scale bar = 100 nm for the main image and 33.3 nm for the inset. (B) 3D reconstruction of a contact between Type II taste cell and the nerve ending (yellow) including visualizations of conventional mitochondria in the nerve ending (magenta), and an atypical mitochondrion (red) and conventional mitochondria (cyan) inside the taste cell (green). Note putative sub-mitochondrial active zone highlighted in blue. Detail to the right shows the method for approximating the volume of the different synaptic compartments.

