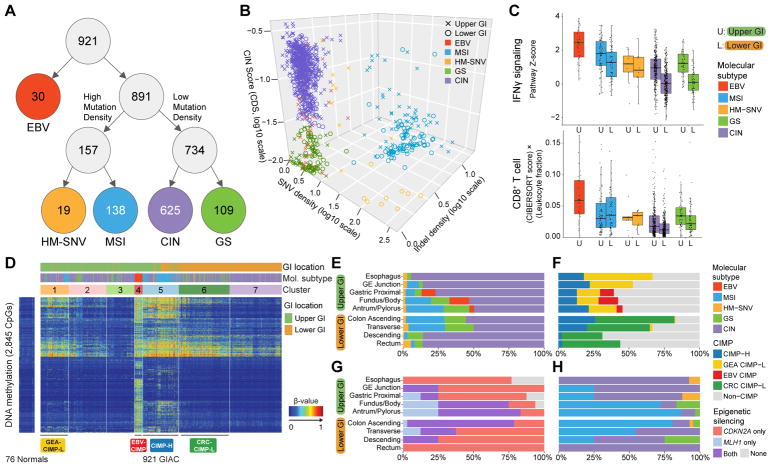
Figure 2. Molecular Subtypes of Gastrointestinal Adenocarcinomas.
(A) Flowchart of molecular subtypes: Epstein-Barr virus (EBV)-positive (red); hypermutated-single-nucleotide variant predominant (HM-SNV) (gold); microsatellite instability (MSI) (blue); chromosomal instability (CIN) (purple); and genomically stable (GS) (green). (B) 3D plot of GIAC by SNV density, indel density, and clonal deletion score (CDS). Tumors annoted as Upper GI (crosses) and lower GI (circles) and color-coded by subtypes. (C) IFNγ pathway score (top) and CD8+ T-cell score (adjusted for total leukocytes; bottom) by subtypes stratified by upper vs lower GI. Horizontal bars indicate median values, boxes represent interquartile range, and whiskers indicate values within 1.5 times interquartile range. (D) Unsupervised analysis of DNA methylation across GIAC. (E, F) Distribution of subtypes (E) and CIMP subgroups (F) across anatomic regions. (G, H) Distribution of MLH1/CDKN2A silencing (G) and subtypes (H) in CIMP-H tumors by anatomic region. See also Figure S2.

