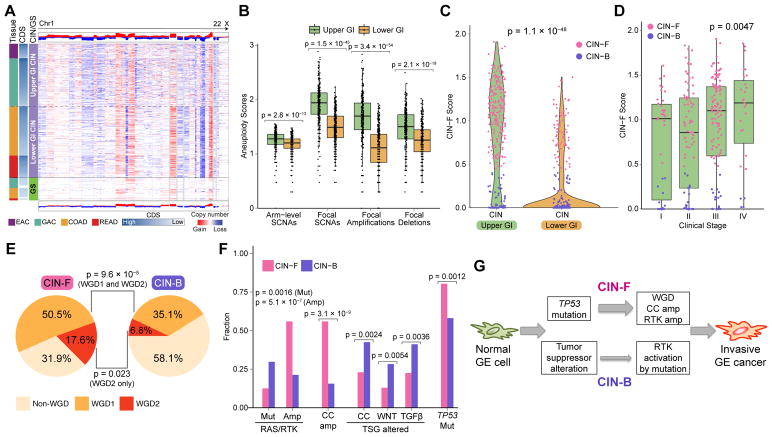
Figure 4. Molecular Features of the CIN Subtype in Upper GI.
(A) Copy-number heatmap of non-hypermutated GIAC with amplification (red) and deletion (blue) with upper GI CIN tumors (top), CIN CRC (middle) and GS (bottom). (B) Plots of arm-level and focal copy-number events in CIN tumors by upper and lower GI tract. Horizontal bars indicate median values, boxes represent interquartile range, and whiskers indicate values within 1.5 times interquartile range. (C) Distribution of CIN-F (CIN-Focal) score by upper and lower GI CIN tumors. CIN-B denotes CIN-Broad. (D) Distribution of CIN-F score by clinical stage in Upper GI. Horizontal bars indicate median values, boxes represent interquartile range, and whiskers indicate values within 1.5 times interquartile range. (E) Whole genome doubling (WGD) in CIN-F and CIN-B tumors in the upper GI tract; WGD1 indicates one WGD, and WGD2 indicates >WGD (F) Frequency of distinct classes of somatic alterations in RAS and receptor tyrosine kinases (RTK; KRAS, PIK3CA, BRAF, ERBB3, ERBB2, NRAS, EGFR, FGFR1, FGFR2), cell cycle (CC; FBXW7, CCNE1, CDK6, CDKN2A, CDKN1B, CCND1, CCND2) and tumor suppressor genes (TSG) including WNT(APC, RNF43, SOX9, TCF7L2, CTNNB1), TGFβ: TGFBR2, ACVR2A, ACVR1B, SMAD4, SMAD2, SMAD) and TP53 in upper GI CIN-F and CIN-B tumors (G) Schematic model of CIN-F and CIN-B pathogenesis in upper GI. See also Figure S4.

