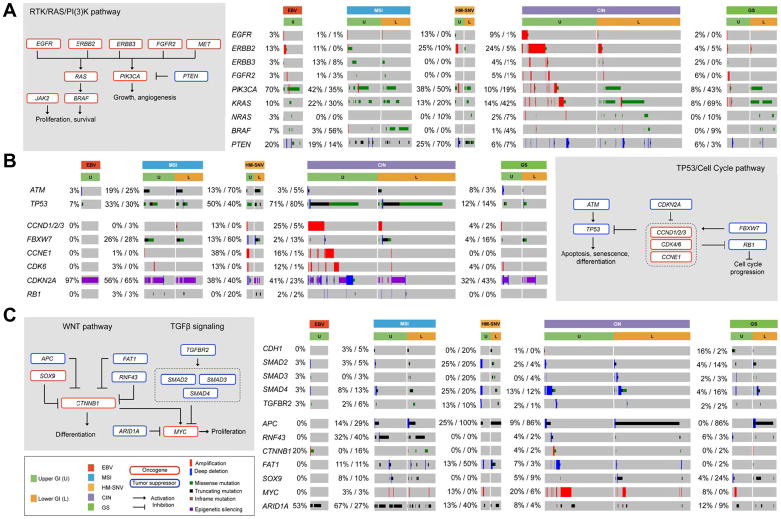
Figure 7. Integrated Molecular Comparison of Somatic Alterations Across GIAC Molecular Subtypes.
(A–C) Alterations in select genes and pathways including RTK/RAS/PI3-K (A), TP53, cell cycle (B), and WNT/TGFβ (C). Deep deletions representing loss of more than half of the gene copies for the given ploidy of the tumor, blue; amplifications, red; missense mutations in the COSMIC repository, green; nonsense or frameshift mutations, black. Percentage of somatic alteration is indicated by numbers to the left of each gene box and divided by upper (U) and lower GI (L).

