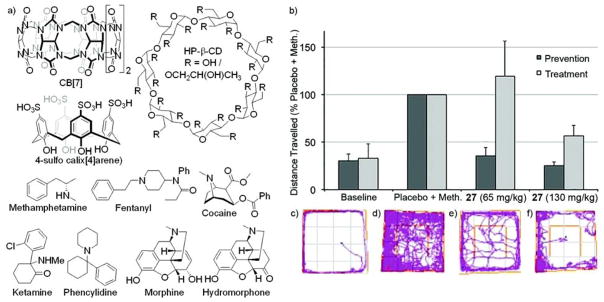
Figure 15.
a) Chemical structures of HP-β-CD, SC4A, and selected drugs of abuse, b) bar graph showing distance traveled as a percentage of the placebo + methamphetamine activity level within 20 min; error bars represent the standard error of the mean. Tracking plots illustrate the distance traveled by one rat within 20 min in the open field; c) baseline, no methamphetamine; d) methamphetamine (0.30 mg/kg) + placebo; e) methamphetamine (0.30 mg/kg) + 27 (65 mg/kg); and f) methamphetamine (0.30 mg/kg) + 27 (130 mg/kg).

