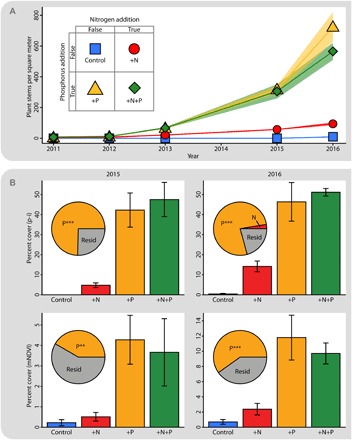
Fig. 1. Three different measures of plant growth in response to a one-time addition of nutrients to soils (in August 2010) that were uncovered by the Puca Glacier 3 years preceding the start of the experiment.

This site was initially barren, but plots with added P exhibited exponential increase in the number of plants within (A). By the fifth year (2015), plant biomass was high enough that it was feasible to measure the percent cover by plants within the plots. This was done manually using the p-i method and digitally using mNDVI in 2015 and 2016 (B). The p-i method yielded almost identical results for 2015 (left) and 2016 (right), and analysis of variance (ANOVA) showed an overwhelmingly large effect size of P addition (ω2, inset, pie charts). mNDVI analysis showed very similar results (bottom of Fig. 3B), although the effect size of P was smaller (***P < 0.001, **P < 0.01). The effect of N addition was not statistically significant in any of these four analyses.
