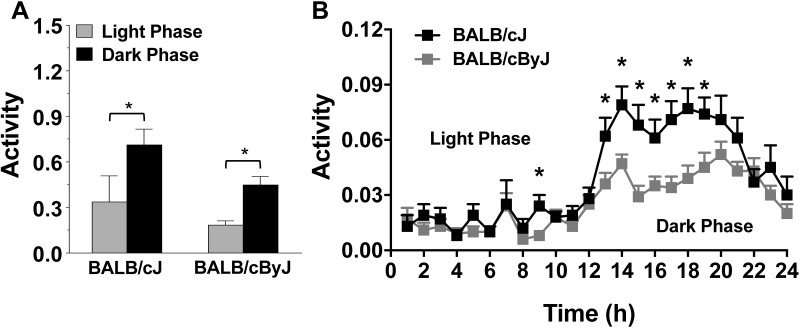
Figure 6.
DVC activity levels of BALB/cJ and BALB/cByJ during the light and dark phases. (A) Mice were evaluated for activity by DVC during the light (gray bars) and dark (black bars) phases of the photoperiod. (B) DVC activity of BALB/cJ and BALB/cByJ mice was scored at each hour over 24 h. Data are shown as mean ± SEM (n = 9 cages per strain) of average DVC activity scores across 12 time points per phase. *, P < 0.05.

