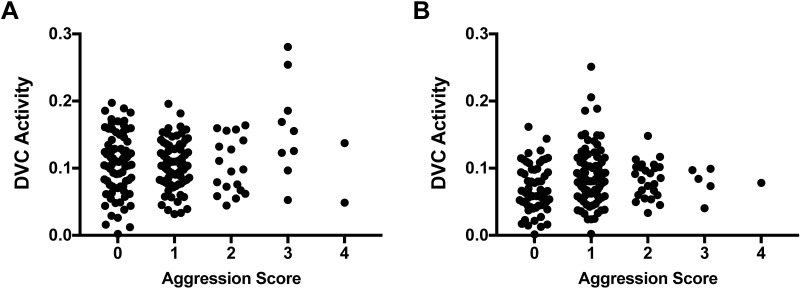
Figure 7.
Scatter plots for DVC activity levels across aggression scores in the removal-and-reintroduction assay. Data were combined for three 10-min tests, with 2 wk between tests. Aggression was manually scored for 1-min periods across each 10-min test, with scores ranging from 0 (no observations of aggression) to 4 (aggression during each 15-s bin across 1 min).

