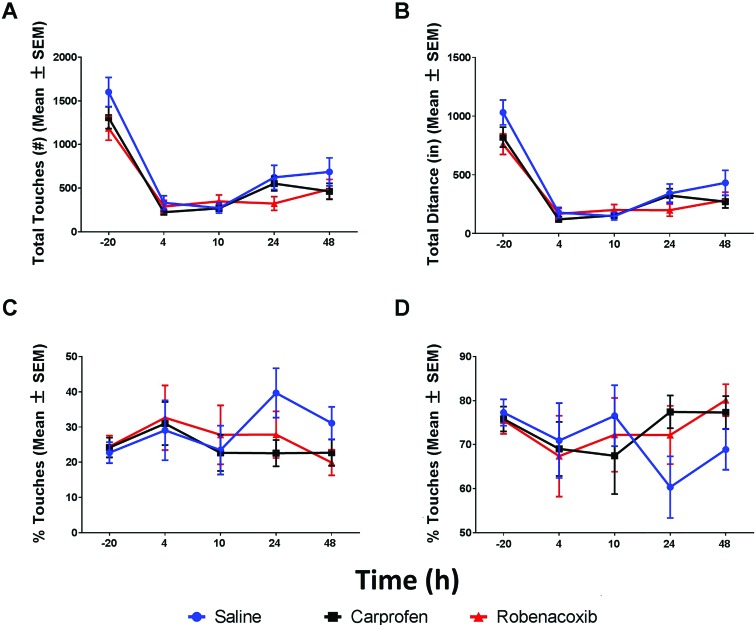
Figure 5.
(A) Total touches (no., mean ± SEM) showing change from baseline for saline and all doses of robenacoxib. All doses show a significant decrease from baseline at all postsurgery time points. (B) Total distance (in., mean ± SEM) showing change from baseline for saline and all doses of robenacoxib. All doses show a significant decrease from baseline at all postsurgery time points. (C) Percentage movement in the inner 50% of the tablet (%; mean ± SEM) shows no significant change from baseline for saline and all dosesof robenacoxib. (D) Percentage of movement in the outer 50% of the table (%; mean ± SEM) shows no significant change from baseline for saline and all doses.

