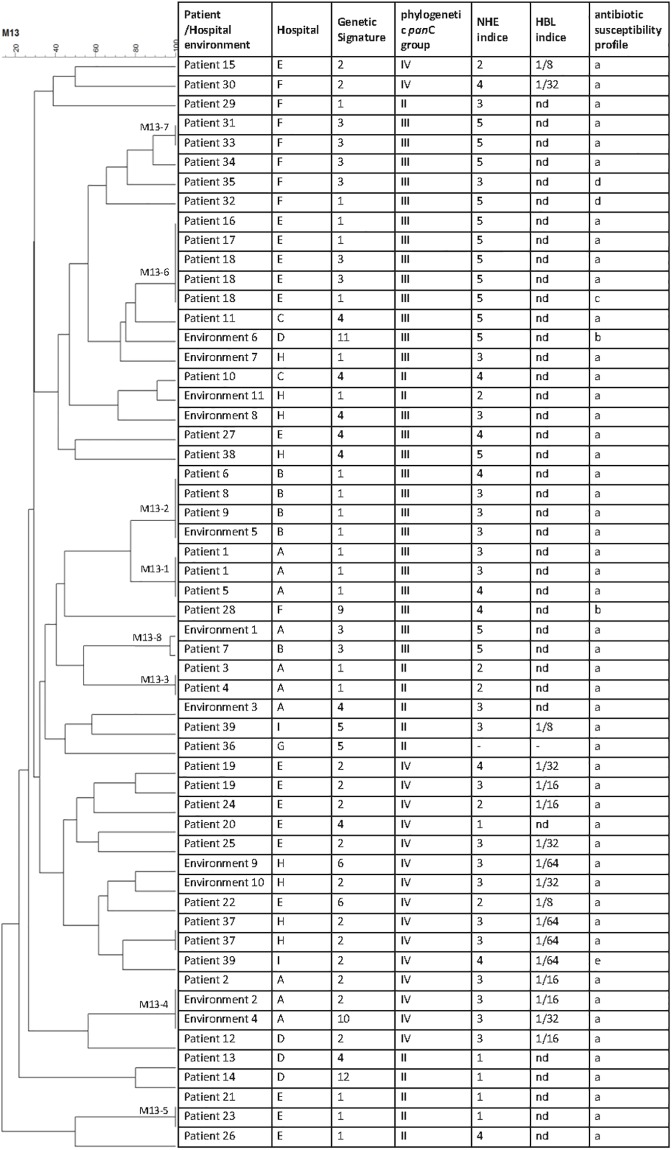
Fig 1. Dendogram and strain data.
Left panel, dendrogram obtained by cluster analysis of M13-PCR fingerprint patterns of the 56 strains. The UPGMA was used to build a dendrogram from a pair wise similarity matrix. Seven clusters were obtained with strains sharing 100% of homology. Right panel, data include for each strain the corresponding patient and hospital, genetic signature, phylogenetic panC group, NHE and HBL indice, and the antibiotic susceptibility profile. nd: not detected.

