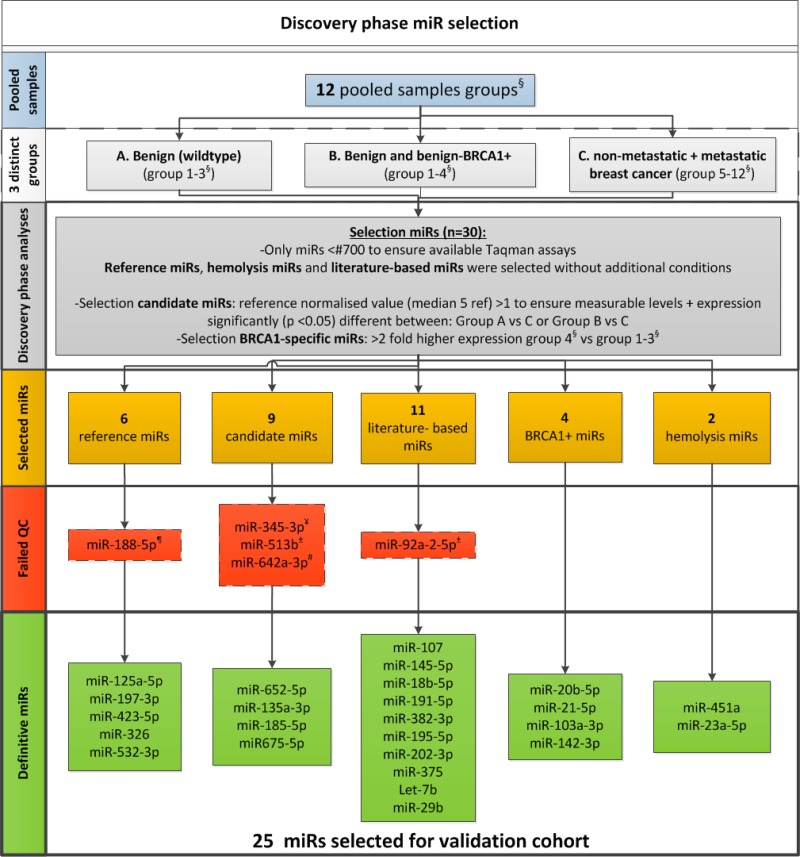
Figure 2. Discovery phase flow-chart.
§Supplementary Table 2 displays a detailed description of the pooled groups. *Mann-Whitney U test. QC = Quality control. ¶Too high expressed in multiplex vs uniplex; appears to detect additional transcripts. ¥Poor amplification and too low expressed for a reliable analysis. ±Too low expressed for a reliable analysis. **Poor amplification curves and poor efficiency in multiplex.

