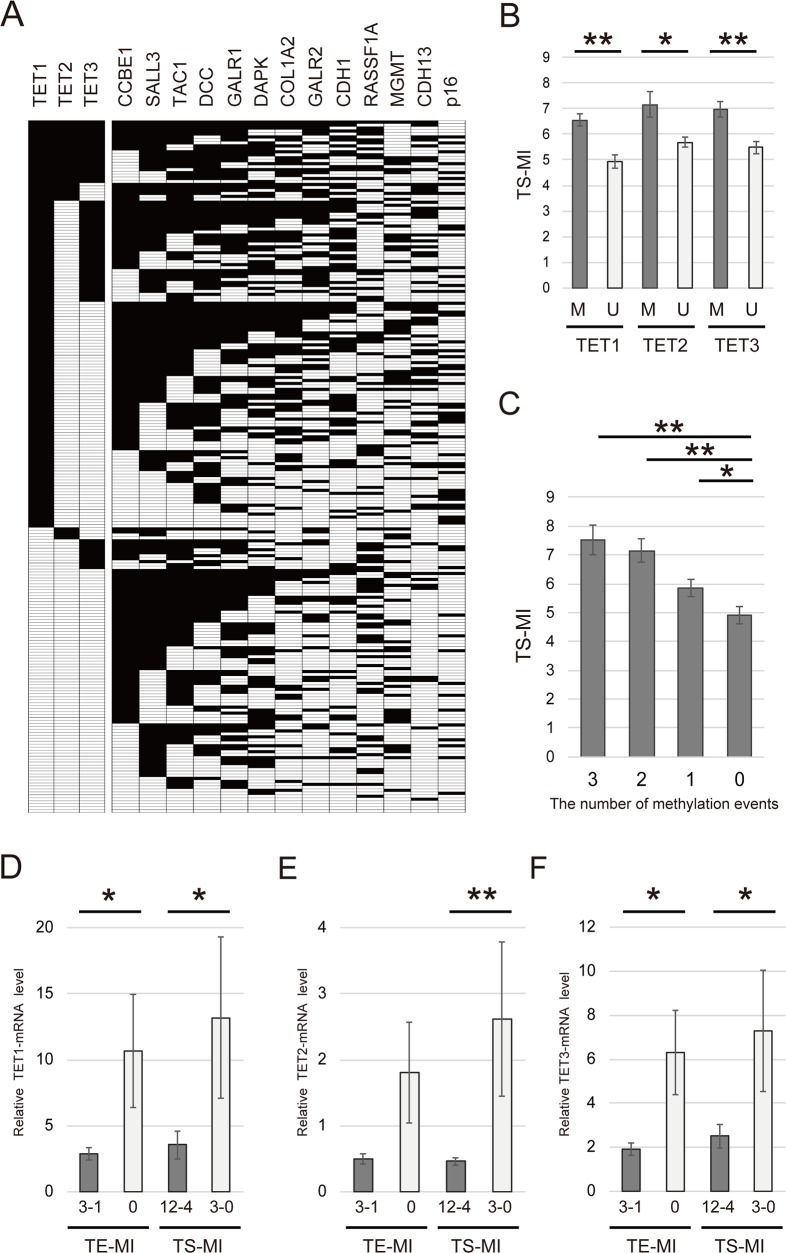
Figure 3. Comparison of methylation rates for 13 tumor suppressor genes and TET family genes in 233 primary HNSCC samples.
(A) Distribution of promoter methylation in TET family genes and 13 tumor suppressor genes. Filled boxes indicate the presence of methylation, and open boxes indicate the absence of methylation. (B) Correlation between the methylation status of TS-MI and TETs in patients with HNSCC. M: methylated; U: unmethylated. (C) Combined analyses involving the methylation status of TS-MI and TET family genes. The number of methylation events was indicated for hypermethylated TET family genes. The mean TS-MI for the different groups was compared using Student's t test. (D) TET1 mRNA levels were significantly higher in groups with lower TE-MI and TS-MI (P = 0.045 and P = 0.024, respectively). (E) TET2 mRNA levels were higher in groups with lower TE-MI compared to those with higher TE-MI (P = 0.055). TET2 mRNA levels were significantly higher in groups with lower TS-MI than in those with higher TS-MI (P = 0.004) (F) TET3 mRNA levels were significantly higher in groups with lower TE-MI and TS-MI (P = 0.012 and P = 0.014, respectively). *P < 0.05. **P < 0.001. The data are shown as the mean ± SE.

