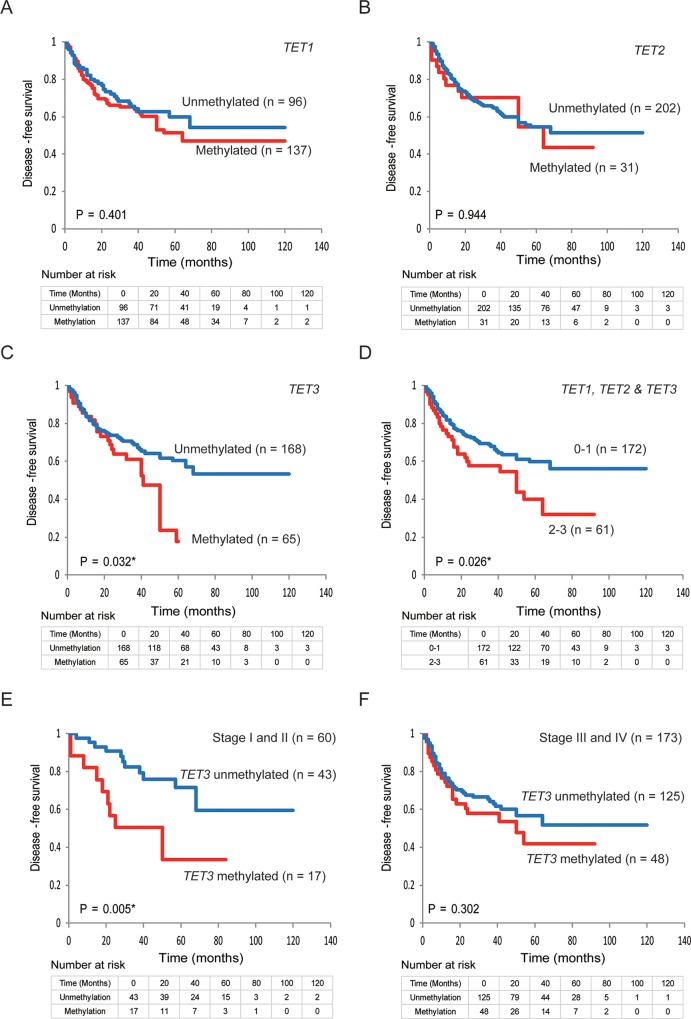
Figure 4. Kaplan-Meier survival curves for patients with HNSCC based on TET family gene methylation status.
Kaplan-Meier survival curves based on TET promoter methylation status in patients with HNSCC. Disease-free survival according to (A) TET1 methylation status; (B) TET2 methylation status; (C) TET3 methylation status; (D) TET1, TET2, and TET3 methylation status; (E) TET3 methylation status in stage I and II patients; (F) and TET3 methylation status in patients with stage III and IV cancers.

