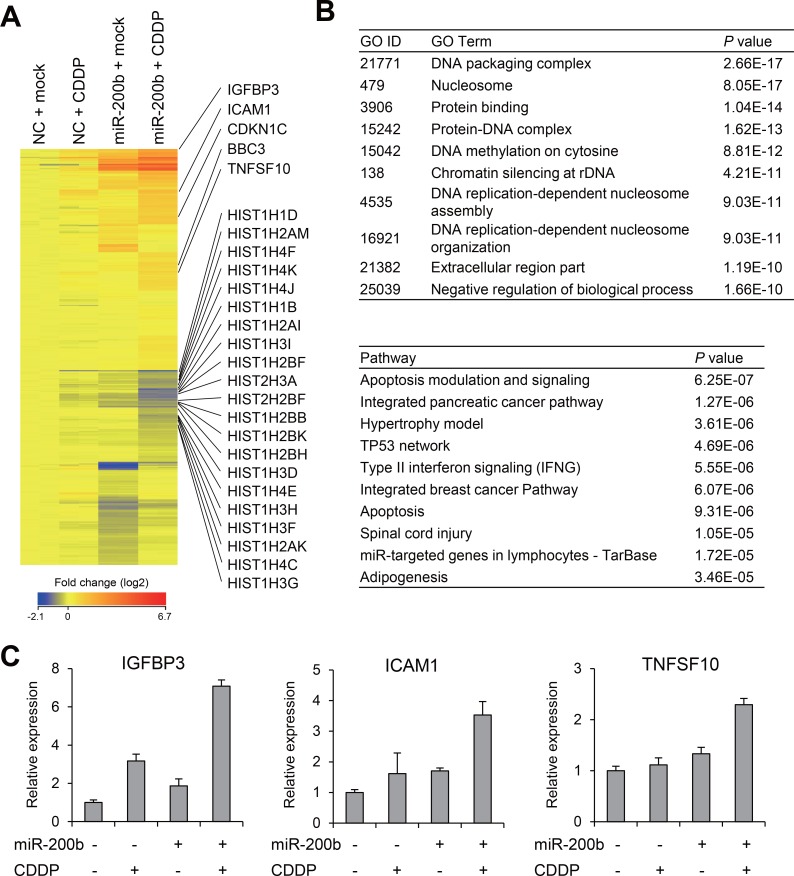
Figure 4. Effects of miR-200b and CDDP on gene expression profiles in CDDP-resistant BCa cells.
(A) Heat map showing expression of 551 probe sets (509 genes) identified through microarray analysis of T24RC cells transfected with a miR-200b mimic or negative control (NC) and then treated with or without CDDP. (B) Results of gene ontology (GO, upper) and pathway analyses (lower) of the selected 509 genes. (C) qRT-PCR analysis of the indicated genes in T24RC cells with or without miR-200b and/or CDDP. Shown are means of 3 replications; error bars represent SDs.

