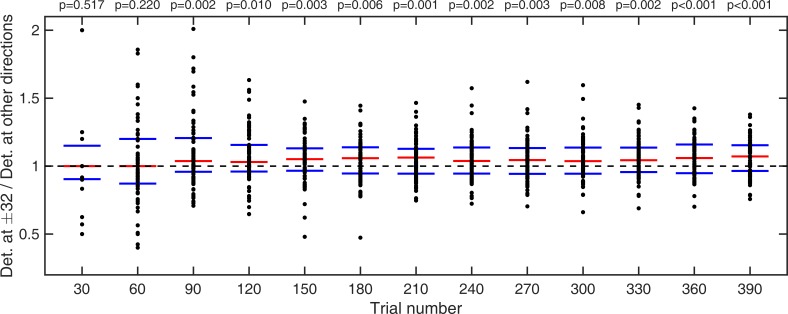
Appendix 1—figure 4. Cumulative moving average of ratio of fraction of detected stimuli at ±32° vs average fraction detected at all other directions.
Red bars indicate median values and blue bars indicate 25th and 75th percentiles. p-values indicate whether fraction detected at ±32° are significantly larger than average fraction detected over all other directions (one-tailed Wilcoxon signed rank test).

