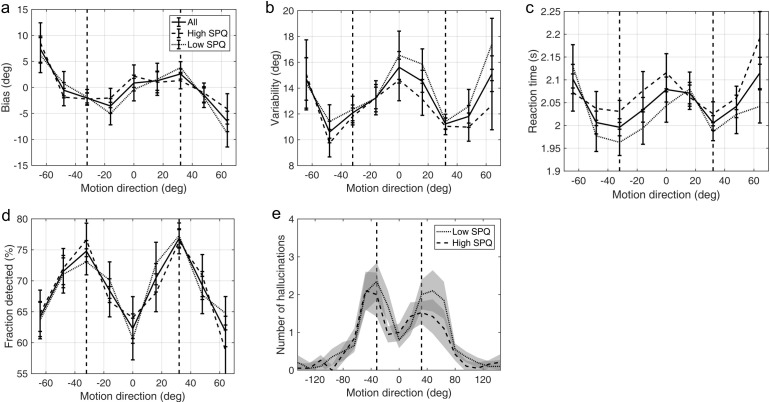
Appendix 1—figure 7. Average group performance on low-contrast trials (a–d) and on trials with no stimulus (e) by groups split by median SPQ score.
(a) Mean estimation bias, (b) standard deviation of estimations, (c) estimation reaction time and (d) fraction of trials in which the stimulus was detected. (e) Distribution of hallucinations. The vertical dashed lines correspond to the two most frequently presented motion directions (±32°). Error bars and shaded areas represent within-subject standard error.

