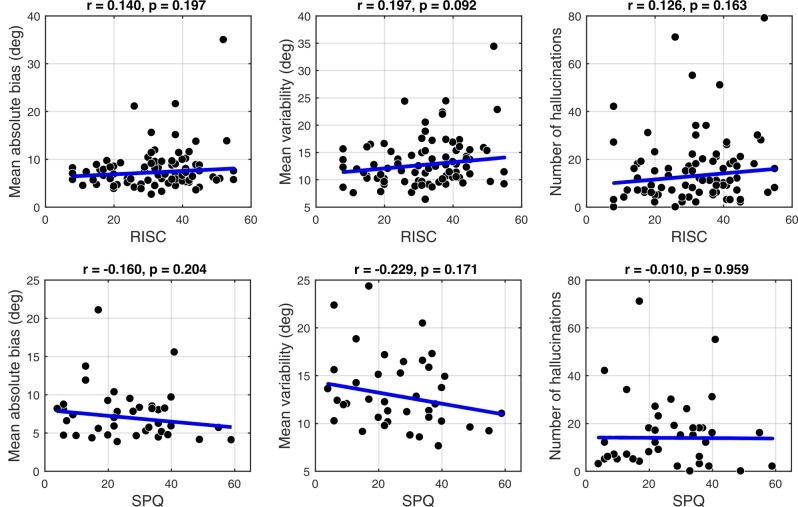
Appendix 1—figure 8. Correlations between personality traits, RISC (top row) and SPQ (bottom row) and task performance.
There were no significant correlations with any of the measures: mean absolute bias (left column), mean estimation variability (middle column) and total number of hallucinations (right column). Robust correlation coefficients and p-values are indicated above each plot. The blue lines denote robust regression.

