. 2018 May 14;7:e34115. doi: 10.7554/eLife.34115

Figure 3. Average group performance on low-contrast trials (a–d) and on trials with no stimulus (e).

Figure 3.

(a) Mean estimation bias, (b) standard deviation of estimations, (c) estimation reaction time and (d) fraction of trials in which the stimulus was detected. (f) Probability distribution of estimation responses on trials without stimulus. The solid line denotes the estimation responses when participants reported detecting a stimulus (hallucinations). The dash-dot line denotes estimation distributions when participants correctly reported not detecting a stimulus. (e) Distribution of hallucinations for high and low AQ groups (median split). The vertical dashed lines correspond to the two most frequently presented motion directions (±32°). Error bars and shaded areas represent within-subject standard error.

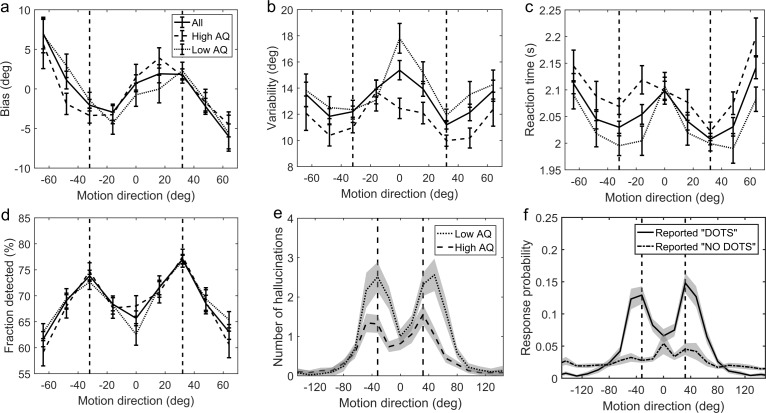
Figure 3—source data 1. This zip archive contains .csv files with all of the data that was used to produce plots in Figure 3.
EstimationBias.csv contains estimation biases at each of the nine presented angles. EstimationVariability.csv contains standard deviation of estimations at each of the nine presented angles. NostimDetected.csv and NostimUndetected.csv contain estimation responses when stimulus was detected and not detected, respectively, on no-stimulus trials. Traits.csv contains AQ scores of each individual (column 3) as well as all other traits. SourceData_Readme.txt contains more detailed description of each data file. The plots can be reproduced from MATLAB script master.m which is available in the provided Source code 1. SourceCode_Readme.txt contains more detailed description of the source code.
DOI: 10.7554/eLife.34115.005