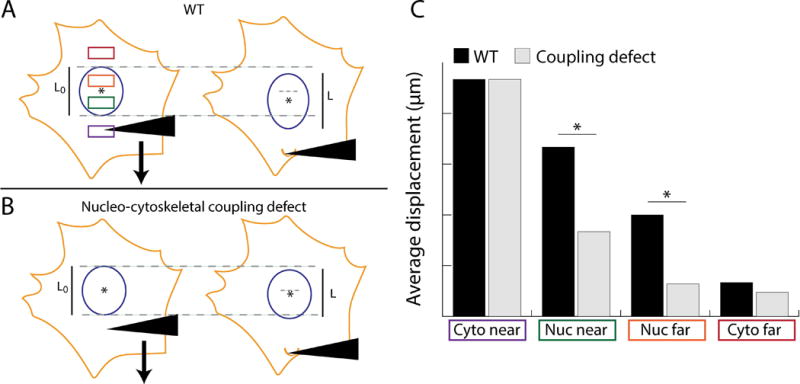
Figure 5. Schematic overview of microharpoon assay and sample results comparing wild type cells with those possessing a nucleo-cytoskeletal coupling defect.

(A) Wild type cell before and after the microharpoon pull. The four discrete regions used to evaluate nucleo-cytoskeletal coupling are shown in the colored boxes: ‘cyto near’ in purple, ‘nuc near’ in green, ‘nuc far’ in orange and ‘cyto far’ in red. (B) Expected results for a cell with a force transmission defect. Note the decrease in nuclear strain along the axis of force application, calculated by dividing the nuclear elongation (ΔL = L – L0) by the initial length, L0, where L is the final length of the nucleus (in the microneedle pull direction) at the end of strain application. Also note the decrease in nuclear centroid displacement. (C) Hypothetical plot of expected results comparing the cells in (A) and (B). The ‘nuc near’ and ‘nuc far’ regions typically provide the most relevant information about nucleo-cytoskeletal coupling, whereas the ‘cyto far’ region is often influenced by high noise. Displacements in the ‘cyto near’ region should show comparable results for both cell types, as these measurements reflect the applied cytoskeletal strain.
