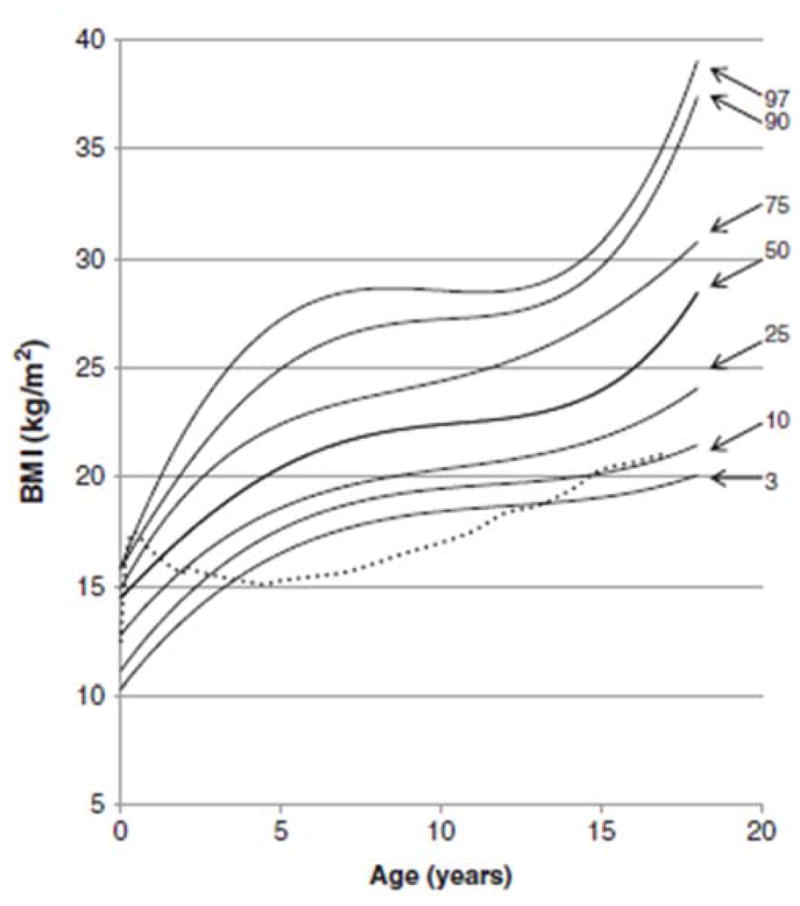
Figure 4.

BMI curve for patients with MPS II from birth to 18 years of age. The dotted line shows the mean BMI for healthy males. The solid line shows BMIs for patients with MPS II. Arrows point to their respective percentile curves. Adapted from Patel et al. (Mol Genet and Metab Rep 1; 2014, 5–18) [8].
