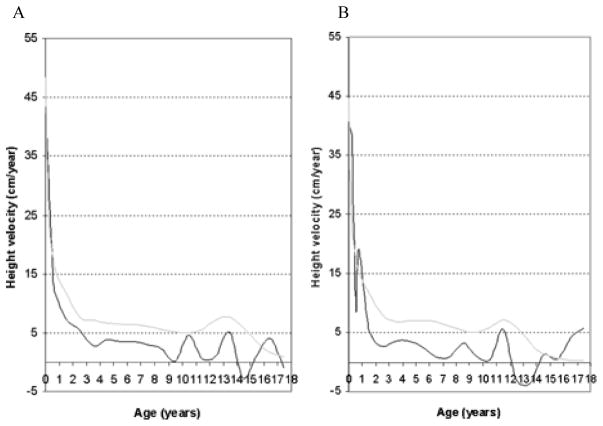
Figure 8.
Growth velocity (cm/year) throughout childhood and adolescence of boys (A) and girls (B) with MPS IVA (copyright permission from International Morquio Organization). The gray line shows the height velocity values for normal boys and girls. Adapted from Tomatsu et al. [6].

