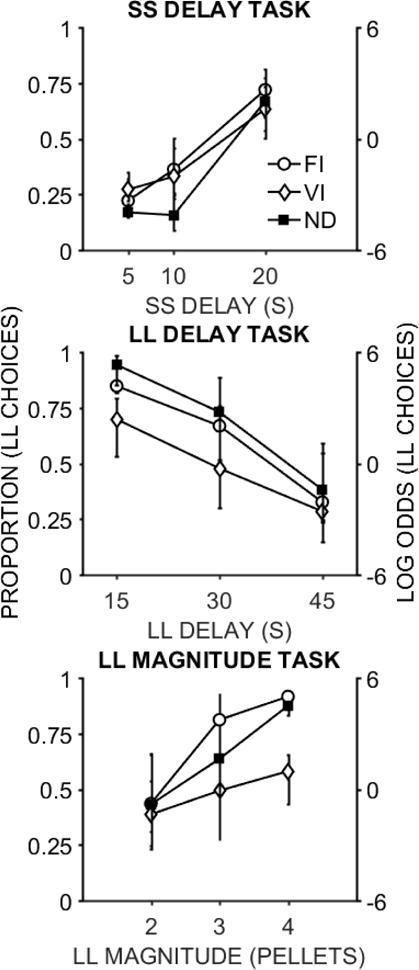
Fig. 2.

The proportion of larger-later (LL) choices as a function of smaller-sooner (SS) delay (top panel), LL delay (middle panel), and LL magnitude (bottom panel) in the fixed interval (FI), variable interval (VI), and no-delay (ND) groups. The right ordinate axis provides the log odds of LL choices as a general reference for interpretation of the unstandardized regression coefficients (b values). The error bars are ± one standard error of the mean, determined from the mixed effects model.
