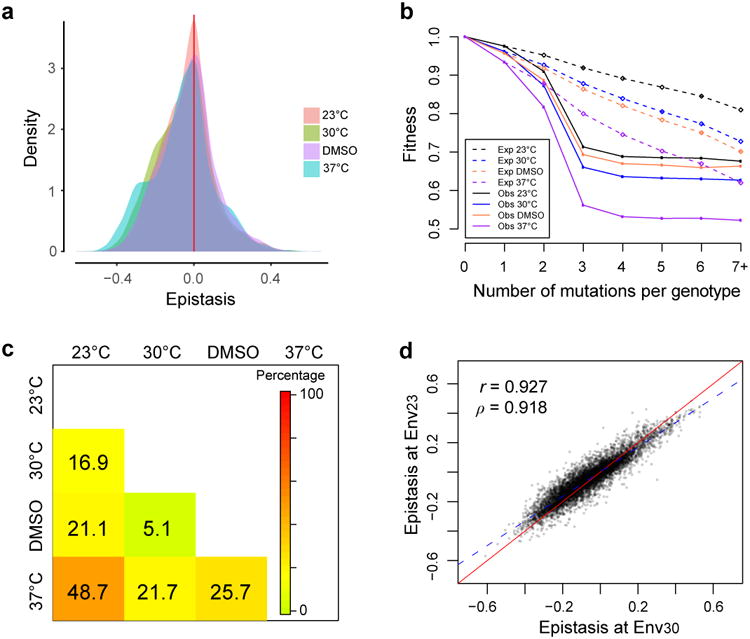
Figure 4. Epistasis-by-environment interaction is prevalent.

a, Frequency distributions of 8,101 epistasis between mutations in four environments. b, Observed mean fitness of mutants carrying a given number of mutations (solid dots) is lower than expected under no epistasis (open diamonds) in each environment. c, Fractions of mutation pairs that exhibit significant G×G×E for each environment pair (nominal P < 0.05, t-test). d, Epistasis measured in Env23 and that measured in Env30 are highly correlated. Pearson's correlation (r) and Spearman's correlation (ρ) are indicated. The red solid line shows the diagonal, whereas the blue dashed line shows the linear regression.
