
Figure 1.
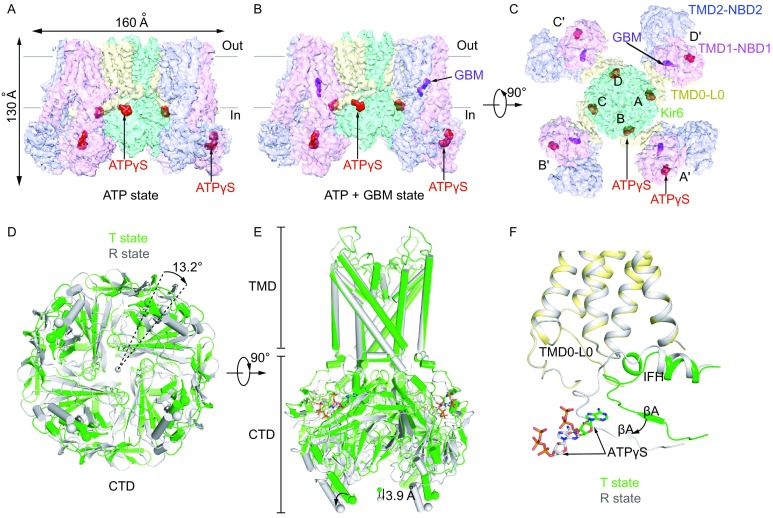
Structures of the pancreatic KATP channel in complex with ATPγS or ATPγS and glibenclamide (GBM). (A) Side view of the KATP channel in complex with ATPγS (ATP state). Approximate extent of the phospholipid bilayer is shown as thick gray lines. Kir6.2, SUR1 TMD0-L0 (transmembrane domain 0-loop 0) fragment, TMD1-NBD1 (nucleotide binding domain1), TMD2-NBD2, ATPγS and GBM are shown in green, yellow, magenta, blue, red and purple, respectively. (B) Side view of the KATP channel in complex with ATPγS and GBM (ATP + GBM state), colored the same as in (A). (C) Bottom view of the KATP channel in complex with ATPγS and GBM from the intracellular side. (D) Bottom view of the aligned Kir6.2 structures between “T state” (green) and “R state” (gray) of the ATP + GBM state. Rotation angle between CTDs (cytoplasmic domain) was measured using Cα positions of L356 of Kir6.2, shown as spheres. (E) Side view of the aligned Kir6.2 structures between “T state” (green) and “R state” (gray) of the ATP + GBM state. Vertical movement of CTDs is measured between the centers of mass of L356 Cαs. (F) Positional difference of Kir6.2 βA and IFH (interfacial helix) between “T state” and “R state” structures of the ATP + GBM state