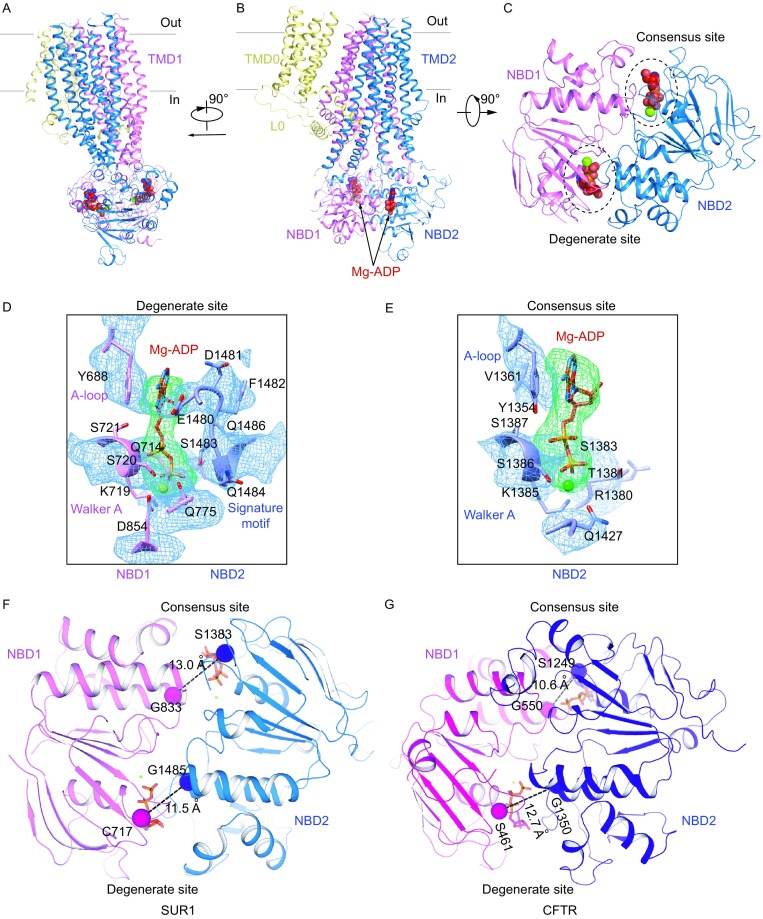
Figure 4.

Mg-ADP on SUR1. (A) Side view of a single SUR1 subunit in cartoon representation. Color scheme is the same as in Fig. 1A. Mg2+ and ADP are shown as green and red spheres, respectively. (B) Side view of a single SUR1 subunit with a 90° rotation relative to panel (A). (C) Bottom view of a single SUR1 subunit with a 90° rotation relative to (B). For simplicity, only NBD1 and NBD2 are shown. Two Mg-ADP molecules are circled. (D and E) EM densities at the degenerate site (D) and consensus site (E), colored as in Fig. 2H. Mg2+ is shown as a green sphere. (F and G) Differences of NBD closures in SUR1 (F) and CFTR (PDB: 5W81) (G). Cα distances between the glycine in the Walker A motif and serine (cysteine instead at the degenerate site of SUR1) in the ABC signature motif are shown as dashed lines
